Usage
First time users
AutoFLpy is a code designed to allow drone pilots and operators to perform agile flight data analysis and presentation. It works by reading the data collected by the flight computer (eg. PixHawk) as well as other sources and creating a complete flight test report in the form of a Jupyter Notebook. This notebook is fully customisable and allows the user to plot any variable collected by its self or with other data.
Upon first time running of the script, sample data will be used to create a sample flight report for the user to look at for inspiration. A folder structure containing the “Input_File.json” and base file paths will also be created. The user can then complete the “Input_File.json” with appropriate information and analyse their own flight data.
The Input_file.json is structured as follows:
{
        "log_to_xlsx_input": {
                "log_file_name": "Your log file to be run",
                "log_file_path": "Set to your storage location. If blank, uses the file path of the sample data. NOTE: file paths need // as separators.",
                "excel_data_file_path": "Destination for the generated excel data. If blank, creates folder in the current directory",
                "date": "YYYYMMDD",
                "flight_number": "Flight number on the date specified"
        },

        "flight_log_generator_input": {
                "template_file_path": "If blank, finds the default template location",
                "template_file_name": "If blank, uses the default template",
                "csv_flight_data_name": "Name of correctly formatted CSV data. If blank, uses the name of the sample data",
                "csv_flight_data_file_path": "Path to CSV data. If blank, finds the path to the sample data",
                "metar_file_path": "METAR data collected will be stored here. If blank, creates folder in the current directory",
                "flight_log_destination": "Destination for the generated flight reports. If blank, creates folder in the current directory",
                "start_time_hours": "HH - 24 hr clock",
                "end_time_hours": "HH - 24 hr clock"
        },

        "weather_data": {
                "Action_time_hh:mm": "Time the weather data was recorded as hh:mm",
                "Temperature_C": "Temperature recorded on the ground in celsius",
                "Pressure_Pa": "Pressure recorded in Pascal",
                "Wind_speed_mps": "Wind speed recorded in meters per second (mps)",
                "Wind_direction_degrees": "Wind direction recorded in degrees from North"
        },

        "runway_data": {
                "Take_off_direction": "This should be entered in degrees with North being 0.",
                "Runway_surface": "What material is the runway? E.g. tarmac/concrete/grass/dirt/ect.",
                "Surface_condition": "What condition is the runway in? E.g. dry/wet/icy/dusty/damaged/ect."
        }
}
For analysing multiple flights in the same Jupyter Notebook, enter the data for the subsequent flights into the Input_File.json separated by a comma (,). Please see the examples page for more details.
To use AutoFLpy:
from autoflpy import log_analysis
Individual flight reports can be generated using the log_analysis function:
log_analysis.autoflpy(input_file='Input_File.json')
When this is run for the first time, a folder structure (user_files) will be created in the current working directory. This will be populated using example data to create an example flight report and the input file.
For changing directories to the data and running your own code, edit the “Input File.json” with the correct data before running the code. A template input file is provided. If no input file is given, the default input file will be chosen.
Folder structure generated:
user_files
- csv_data Contains sample CSV data such as recorded by an Arduino data. User data in the form of a csv file can be added here.
- excel_file_path Contains excel files generated from the log files.
- flight_logs_generated Contains the generated flight reports.
- log_files Contains the user input flight data in the .log format.
- METAR_storage This acts as a database for the METAR data.
The user should place any flight data to be analysed into the log_files folder if no specific directory is set in the input file. The data needs to be in a .log format (generated by converting the .bin file generated by an ArduPilot into a .log file using Mission Planner).
Additional data should be saved as a .csv with correctly formatted column headings (VariableName_Unit_DataSet_FlightDateYYYYMMDD_FlightNumber) and placed into the csv_data folder. The name needs to be entered into the input file.
The generated flight reports can be found in the “flight_logs_generated” folder if not specific directory is set in the input file. These reports are generated in the form of Jupyter notebooks which should be opened using Jupyter and all cells should be run before converting to other formats. An export to HTML is recommended and allows the code used to generate the report to be hidden. These notebooks are based on a template which will be generated in the user_files directory (“Default_Template_(Full_Summary).ipynb”). The template can be edited to reflect the users needs prior to generating the reports.
The following should be noted when editing the default template notebook:
Principle of template operation
The template will only accept capital letters as inputs in the cells. Only certain words in certain configurations will be checked. AutoFLpy will use these to add/ remove information or cells based on external information.
Graphs
Creating graphs
If you wish to create a graph, then you can create an empty cell with GRAPH at the top in capital letters. A new line must follow this, then the data used must be stated in the format axis, name, data source. This is done as many times as required. This should look as follows.
GRAPH
Y GROUNDCOURSE GPS
Y ALTITUDE GPS
X TIME GPS
The python code scanning through the notebook will find all the variables and provide no spelling mistakes or missing information a graph will be plotted. Note that each y value must have a matching x value from the same data source, but multiple x data sources can be put into a graph cell providing that the units all match (This is to try and ensure that they are same value but plotted in a different place). Multiple x data sources with different units cannot be plotted on the same graph but values with differing y data sources and units can be plotted.
GRAPH
Y GROUNDCOURSE GPS
Y ALTITUDE GPS
X TIME GPS
Y CLIP0 VIBE
Y CLIP1 VIBE
Y CLIP2 VIBE
X TIME VIBE
X TIME RCIN
Y FLAP_CH5 RCIN
Y SUBDEPLOY_CH6 RCIN
Note: the labels that have a gap in them (Flap_CH5 and SUBDEPLOY_CH6) use an underscore instead of a space. This is to avoid any confusion as to the data source and name.
Graph types
There are three main types of graphs that will be automatically generated. Note that the graph type cannot be selected by the user.
Plot type 1 These are simple x and y graphs. Both x and y names and units are displayed, there is no legend.
Plot type 2 These are x and y graphs with multiple y values of the same unit. A legend is displayed and the y axis contains a label which shows the names of the variables plotted and their units
Plot type 3 These are x and y graphs with multiple y values with different units. The legend shows the names of the variables and their units. The y axis has no label or units.
Mapplot This is a special case of the standard graph and is active when Latitdue and Longitude are plotted against each other. A map is plotted behind the data aid with flight visualisation.
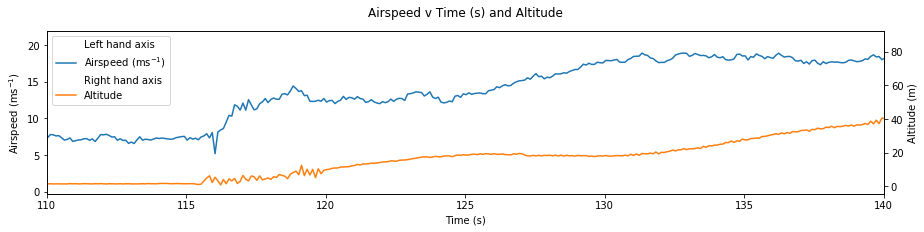
Multiaxis graphs
Multiaxis graphs will have left and right axis. These are like the normal graphs but the text to create the graph is MULTIAXIS_GRAPH. To state the data for the left axis the label is LEFT_AXIS and to state the data for the right axis, the label is RIGHT_AXIS.
MUTLIAXIS_GRAPH
LEFT_AXIS
X TIME ARDUINOMICRO
Y TEMP0 ARDUINOMICRO
RIGHT_AXIS
X TIME RCIN
Y THROTTLE_CH3 RCIN
Note that the default axis is the left axis. If the Y axes have the same source, then X does not need to be stated twice. Note that if the left axis information is missing, the graph will behave like a normal graph but with the axis on the right. It will behave as a normal graph if no right axis data is put in. If no valid data is put in then nothing will be plotted or returned.
METAR information
The text METAR_INFORMATION will import a paragraph of text stating the METAR information for the input times and dates. METAR_INFORMATION must be on a cell on its own and the variable include_metar when calling autoflpy must be set to True for this to work.
METAR_INFORMATION
An example showing how the cell must be laid out for METAR information. The METAR information paragraph created will have an anchor with the id “METAR-Information”.
Weather and runway information
Weather information and runway information entered into the input file are generated through the following keys respectively:
WEATHER_INFORMATION
RUNWAY_INFORMATION
AutoFLpy template labels and text
Label Function
GRAPH Identifies cell as a graph cell.
X NAME DATA_SOURCE X data from column with name NAME from data source DATA_SOURCE. This must be paired with at least one y column from the same data source.
Y NAME DATA_SOURCE Y data from column with name NAME form data source DATA SOURCE. This must be paired with an x column from the same data source.
MULTIAXIS_GRAPH Identifies cell as a multiaxis graph.
LEFT_AXIS Labels data for left axis on multiaxis graph.
RIGHT_AXIS Labels data for Right axis of multiaxis graph.
GRAPH_TEXT Removes cell containing this label when there is no data to create graphs with.
GRAPH_LINE Removes line containing this label when there is no data to create graphs with.
METAR_INFORMATION When METAR_INFORMATION is placed in a cell, this will place a cell containing the METAR data when available.
METAR_TEXT Removes cell containing this label when there is no METAR data for that date.
METAR_LINE Removes line containing this label when there is no METAR data for that date.
WEATHER_INFORMATION When WEATHER_INFORMATION is placed in a cell, this will place a cell containing the weather data from the input_file.json when available.
WEATHER_TEXT Removes cell containing this label when there is no weather data entered.
WEATHER_LINE Removes line containing this label when there is no weather data entered.
RUNWAY_INFORMATION When RUNWAY_INFORMATION is placed in a cell, this will place a cell containing the runway data from the input_file.json when available.
RUNWAY_TEXT Removes cell containing this label when there is no runway data entered.
RUNWAY_LINE Removes line containing this label when there is no runway data entered.
Additional data sources recorded by the flight computer
The current capability of AutoFLpy to plot data collected by the autopilot extends to the data collected in the .bin file. A large quantity of this data is of no use to the majority of AutoFLpy’s users and hence the standard data sources that are loaded are as follows:
GPS
AOA
CTUN
RCIN
RCOU
ARSP
BARO
ATT
VIBE
BAT
AETR
EV
More information on these data sources and their explanations can be found on the ArduPilot webpage.
If any data sources that are not listed above are of interest to the user, these need to be added to the Data_sources.txt file before AutoFLpy is run.
Care has been taken to add information about interpreting all the individual data sources. If missing/incorrect data has been found, this needs to be adjusted in the Name_converter_list.txt file found in the local installation or on GitHub.